


In this video, Joe walks through a comprehensive lesson on using the ADX (Average Directional Index) as part of a technical analysis strategy. Joe explains the key components of the ADX indicator, how to interpret DI+ and DI- lines, and how to identify strong or weak trends in the market. He also covers how to combine ADX with price action and volatility to improve timing and trading decisions.
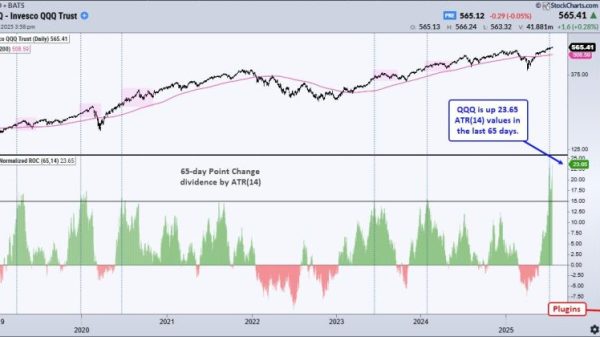
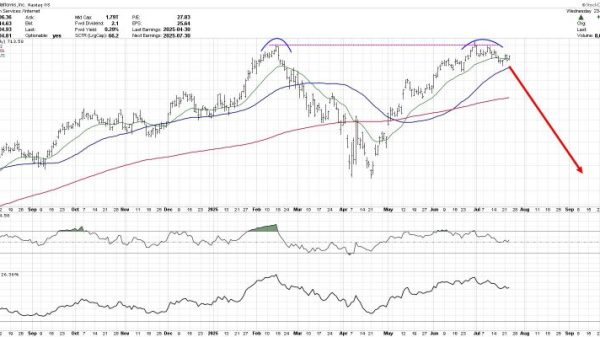
In addition, Joe analyzes SPY, QQQ, IWM, and individual stocks like AMPX, UNH, and more, focusing on trend conditions, MACD, price structure, and key moving averages.
The video premiered on June 4, 2025. Click this link to watch on Joe’s dedicated page.
Archived videos from Joe are available at this link. Send symbol requests to stocktalk@stockcharts.com; you can also submit a request in the comments section below the video on YouTube. Symbol Requests can be sent in throughout the week prior to the next show.