


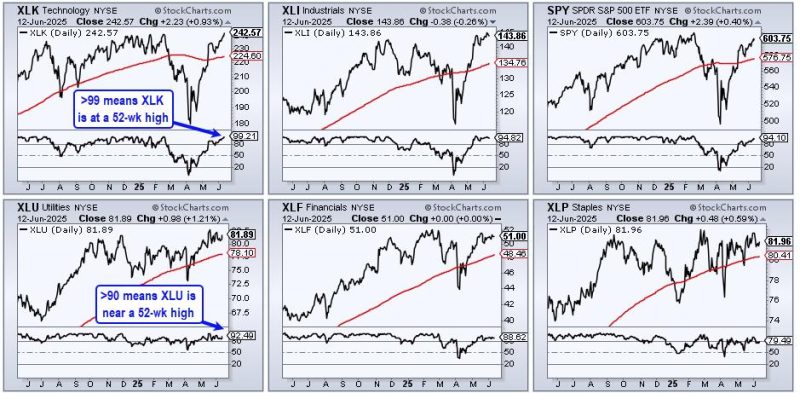
Three sectors stand out, with one sporting a recent breakout that argues for higher prices. Today’s report will highlight three criteria to define a leading uptrend. First, price should be above the rising 200-day SMA. Second, the price-relative should be above its rising 200-day SMA. And finally, leaders should trade at or near 52-week highs. Let’s compare the Utilities SPDR (XLU) to see how it stacks up.
The CandleGlance charts below show the top five sectors and SPY. I am ranking performance using Fast Stochastics (255,1). Stochastic values reflect the level of the close relative to the high-low range over the given period. 255 trading days is around 1 year. An ETF is at a 52-week high when the value is above 99 (XLK) and an ETF is near a new high with a value above 90 (XLU). The CandleGlance charts show XLK, XLI and XLU with values above 90, which means the are near new highs.
***********************
TrendInvestorPro is following the breakout in XLU, the bull flag in GLD, a small wedge in AMLP, a breakout in XLP and more. We also covered trailing stop alternatives for the pennant breakouts in some key tech related ETFs. Take a trial and get three free bonus reports.
***********************
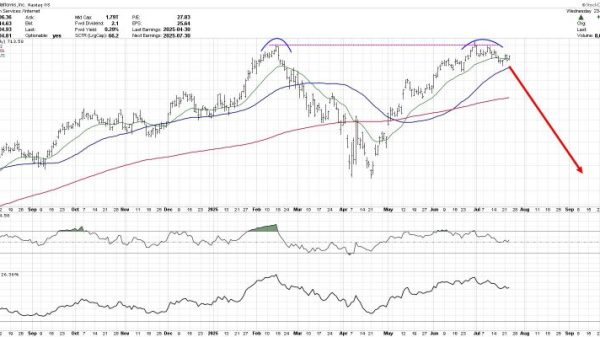
Now let’s turn to price action. XLU is trading above its rising 200-day SMA. Thus, the long-term trend is up. XLU also broke falling channel resistance in early May. The pink lines show a falling channel that retraced around 61.8% of the July-December advance (23.6%). Both the pattern and the retracement amount are typical for corrections within a bigger uptrend. The early May breakout signals a continuation of the long-term uptrend and new highs are expected. The May lows mark first support at 78. A close below this level would warrant a re-evaluation.
And finally, let’s measure relative performance using the price-relative (XLU/RSP ratio). The lower window shows the price-relative in an uptrend for over a year and above its 200-day SMA since early March. This shows long-term relative strength. The pink trendlines show relative performance corrections when XLU underperformed for short periods. XLU is currently experiencing an underperformance correction because the broader market surge from early April to early June.
TrendInvestorPro is following the breakout in XLU, the bull flag in GLD, a small wedge in AMLP, a breakout in XLP and more. We also covered trailing stop alternatives for the pennant breakouts in some key tech related ETFs. Click here to learn more and gain immediate access.
//////////////////////////////////////////////////